|
I found a web that can help teachers to teach pupils about making a bar graph and line graph as well as interpreting the data. Click the button below. These are some worksheets from the web. Besides, at the age of 8, the pupils already need to learn how to interpret data by using a bar graph in human growth. You can check in Science Activity Book (KPM okkkkk). 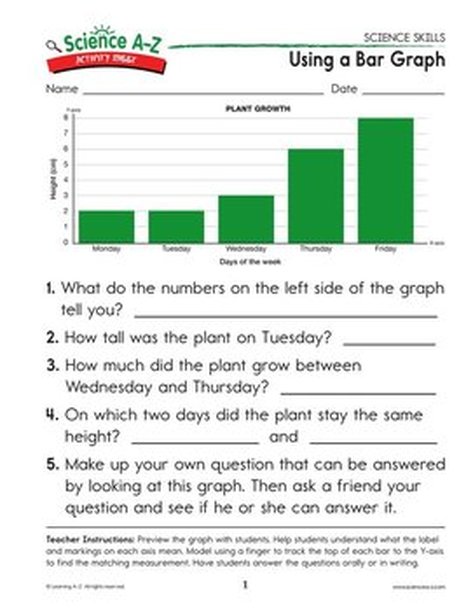 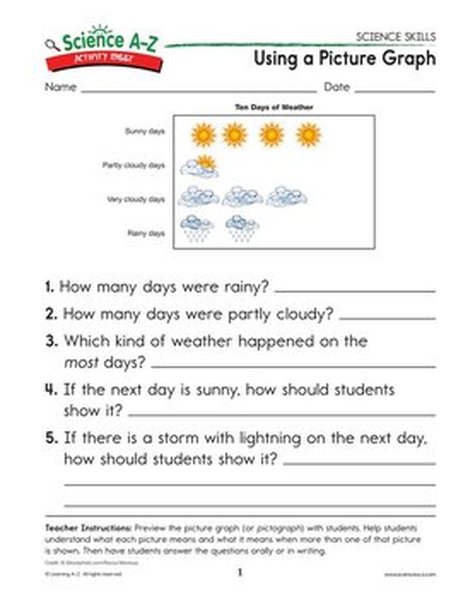
1 Comment
|
 RSS Feed
